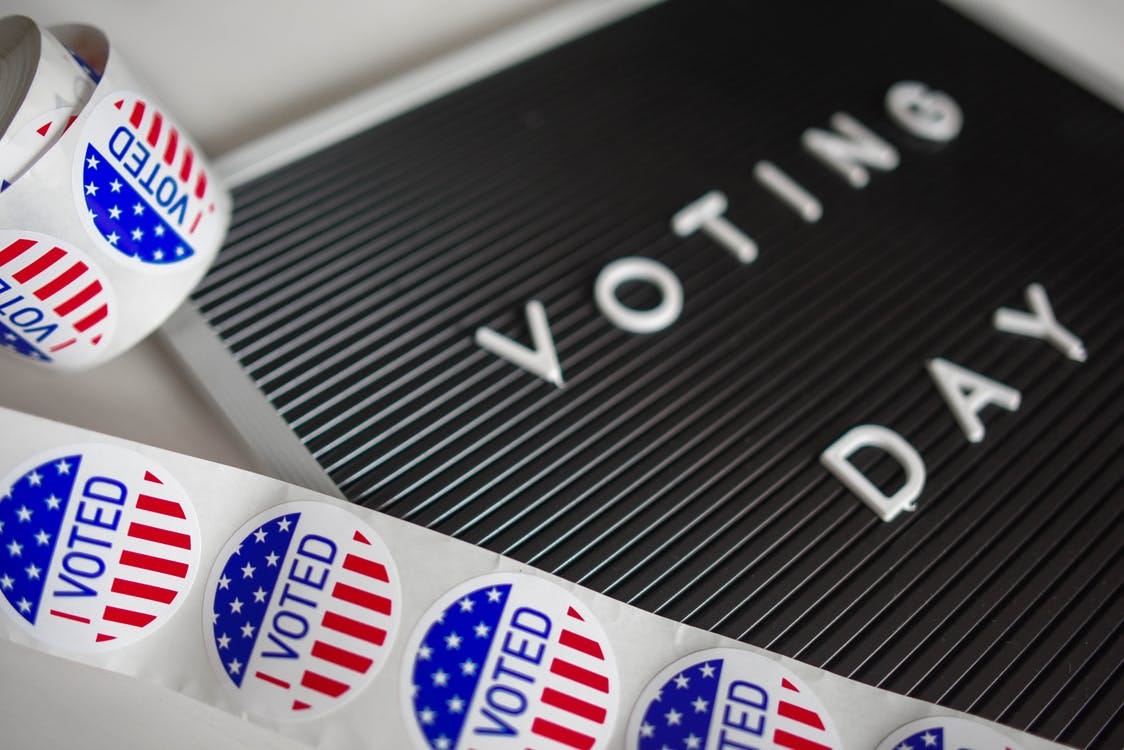
My friends, we’ve finally made it to Election Day! Sometime over the next few hours - or, more likely, days - we’ll know whether or not President Donald J. Trump will remain at 1600 Pennsylvania Avenue for another four years or be replaced by former Vice President Joe Biden in January. Some general thoughts as the night progresses:
The Early Vote Effect
As I mentioned earlier, more than 100 million Americans voted prior to today - a figure that is expected to be around two-thirds of the final vote total when all is said and done. But how does this all factor into the final vote tally?
Each state counts its early votes differently - some start with their early/absentee votes, while others mix them in as they begin to count their Election Day in-person totals. So it’s not surprising that we’re seeing results at 10:00 p.m. Eastern like:
Trump winning the Commonwealth of Virginia 56% to 42% with 45% reporting, when votes from much of deep-blue Arlington, Alexandria, and Fairfax Counties are still outstanding;
Macomb County, Michigan (Detroit suburb) showing Trump up 69% to 30% with 35% reporting when Trump won the county 54% to 42% Clinton in 2016; and
Maricopa County, Arizona (Phoenix, Scottsdale, and their suburbs) showing Biden up 54% to 45% with 77% reporting when Trump won the county 49% to 46% Clinton in 2016.
To put this all into context: Northern Virginia saw record turnout in early voting. Same with Michigan. Arizona, which has had an early voting system in place for several years now, was prepared for an influx of early ballots and so it was able to report its early returns in a timely manner.
How these states and counties fill out over the next few hours will give us a much better picture not only of the general electorate but perhaps also some insight into who voted early and how.
Oy, the Suburbs!
A big part of the reason that Democrats performed so well in 2018 - and ultimately took back the House of Representatives - is because they decimated Republicans in the suburbs of major cities such as Philadelphia and Washington, D.C. That trend doesn’t appear to be changing in 2020.
Among the counties that Biden is currently overperforming Clinton’s 2016 totals (thus far) include:
Lake County, Ohio (Cleveland suburbs, 61% reporting): 51% Biden in 2020, 40% Clinton in 2016
Mecklenburg County, North Carolina (Charlotte and its immediate suburbs, 85% reporting): 68% Biden in 2020, 63% Clinton in 2016
Cobb County, Georgia (Atlanta suburbs, 31% reporting): 64% Biden in 2020, 49% Clinton in 2016
While there are still quite a few votes outstanding in many of these places, the simple fact is that the GOP doesn’t seem to have course-corrected from its 2018 mistakes. And with younger voters projected to continue voting for Democrats as they age, it will only be that much harder for Republicans to expand their coalition beyond their base in future cycles.
In short: Even if Trump wins, his victory is only masking a much larger problem that the GOP’s candidate(s) in 2024 and beyond will need to address.
County-by-County Breakdown
We’re not going to know who won many swing states until late tonight, if not tomorrow at the earliest.
But one way to get an idea of who may be winning each state is by looking at the county-by-county returns as they come in. We can do this by comparing Trump’s vote share in 2016 by his 2020 vote share; if he’s winning key counties this year by less than his previous vote share then Biden has a chance of flipping the state. If Trump’s numbers are stable or stronger, then Trump has a good chance of holding the state.
Florida is a good early case study of this:
Miami-Dade County (84% counted): Trump 45% in 2020, Trump 34% in 2016
Duval County (75% county): Trump 45% in 2020, Trump 49% in 2016
Osceola County (83% counted): Trump 40% in 2020, Trump 36% in 2016
Politico has 2016 county-by-county breakdowns available for your convenience.
Obviously, these numbers will change as the night goes on, but they’ll at least give us something to work with as we await final calls.
Exit polling
Even more so than general polls, which should ALWAYS be taken as a “snapshot in time” and not a guarantee of anything, conducting traditional exit polling this year is even more difficult than normal because of the high percentage of early/absentee voting.
Initial analysis of this year’s exit polls show numbers that are favorable toward Trump - including the economy as the top issue and a focus on rebuilding the economy rather than fighting the spread of the novel coronavirus. Yet a closer deep-dive at the methodology shows this:
CNN Exit Polls are a combination of in-person interviews with Election Day voters and telephone polls measuring the views of absentee by-mail and early voters, and were conducted by Edison Research on behalf of the National Election Pool. In-person interviews on Election Day were conducted at a random sample of 115 polling locations nationwide among 7,774 Election Day voters. The results also include 4,919 interviews with early and absentee voters conducted by phone. Results for the full sample have a margin of error of plus or minus 2 percentage points; it is larger for subgroups.
Why do I bring this up? Because more than 100 million people voted before today, a number that will likely equate to about two-thirds of all voters in this election. Not only do the aforementioned exit polls not match that breakdown, but it’s predicted that the early voters lean Democrat.
Again, initial speculation, but food for thought.